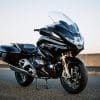
Motor vehicle theft in Australia increased by 3% in the past year, largely due to a 9% rise in motorcycle theft.
Motorcycle theft rose by 720 vehicles to a total of 8928, with a recovery rate of 48% in the 12 months to March 2019, according to the National Motor Vehicle Theft Reduction Council.
Joy ride theft was up 7%, but profit-motivated theft, usually by organised gangs, was up 10%.
This is a worrying trend because motorcycle thefts in 2018 were up 7.3%.
Motorcycle theft is also up 1.5% in the past four years compared with the previous four. But then motorcycle ownership is also up.
Thefts rise in most states
Council spokeswoman Caitlin Hrambanis says the biggest rise in motorcycle theft continues to be in NSW and Queensland.
| State or Territory | 2017-04 to 2018-03 | 2018-04 to 2019-03 | % change | ||
|---|---|---|---|---|---|
| Thefts |
% of thefts
|
Thefts |
% of thefts
|
||
| ACT | 138 | 105 | -23.9% | ||
| NSW | 1,758 | 2,022 | 15.0% | ||
| NT | 113 | 84 | -25.7% | ||
| QLD | 1,474 | 1,794 | 21.7% | ||
| SA | 542 | 623 | 14.9% | ||
| TAS | 120 | 162 | 35.0% | ||
| VIC | 2,031 | 2,051 | 1.0% | ||
| WA | 2,032 | 2,087 | 2.7% | ||
| AUS | 8,208 | 100.0 | 8,928 | 100.0 | 8.8% |
Queensland’s rise could be explained by the fact that it left the National Motor Vehicle Theft Reduction Council seven years ago under the Newman Government.
It will rejoin the body from July 1 to find ways of preventing vehicle theft.
The RACQ has applauded the move.
“The Police Minister’s commitment to rejoin this theft prevention group is the right move,” says safety officer and Bonneville rider Steve Spalding.
“Since 2012 our leaders have backed out of financially supporting the [council] and subsequently missed out on receiving funding for locally delivered crime prevention programs, so we’re now looking forward to seeing our state reap these long-awaited benefits.”
The council is currently investigating the efficacy of tougher penalties for vehicle theft.
The worst hotspots for motorcycle theft continue to be South East Queensland, Melbourne, Sydney/Newcastle and Perth.
| State or Territory | LGA | 2014-04 to 2015-03 | 2018-04 to 2019-03 | % change |
|---|---|---|---|---|
| QLD | Brisbane (City) | 299 | 448 | 49.8% |
| QLD | Gold Coast (City) | 157 | 269 | 71.3% |
| VIC | Melbourne (City) | 137 | 254 | 85.4% |
| QLD | Logan (City) | 113 | 182 | 61.1% |
| NSW | Sydney (City) | 118 | 163 | 38.1% |
| NSW | Newcastle (City) | 45 | 158 | 251.1% |
| QLD | Moreton Bay (Regional Council) | 124 | 155 | 25.0% |
| WA | Swan (City) | 109 | 147 | 34.9% |
| WA | Stirling (City) | 141 | 146 | 3.5% |
| WA | Broome (Shire) | 96 | 126 | 31.2% |
Easy to steal
Motorcycles and scooters are the easiest vehicles to steal because they are lighter than other vehicles and difficult to lock and anchor.
And the lighter the bike or scooter, the more likely it is to be stolen.
| Cubic capacity | 2014-04 to 2015-03 | % of thefts | 2018-04 to 2019-03 | % of thefts |
|---|---|---|---|---|
| 50 cc or less | 1,048 | 890 | ||
| 51 – 100 cc | 178 | 97 | ||
| 101 – 150 cc | 835 | 957 | ||
| 151 – 200 cc | 137 | 168 | ||
| 201 – 250 cc | 1,110 | 942 | ||
| 251 – 500 cc | 978 | 1,187 | ||
| 501 – 750 cc | 782 | 833 | ||
| 751 – 1000 cc | 394 | 437 | ||
| 1001 cc or more | 288 | 290 | ||
| Electric | 1 | 1 | ||
| Unknown | 2,255 | 3,126 |
This is also reflected in the prevalence of scooter brands in the most marques.
Obviously, the most common motorcycles on the road also feature in the theft stats.
| Make | 2014-04 to 2015-03 | 2018-04 to 2019-03 |
|---|---|---|
| Honda | 1,571 | 1,882 |
| Yamaha | 1,475 | 1,540 |
| Kawasaki | 734 | 819 |
| Suzuki | 769 | 772 |
| KTM | 482 | 604 |
| SYM | 188 | 252 |
| Harley-Davidson | 171 | 225 |
| Kymco | 111 | 222 |
| Piaggio | 142 | 203 |
| Triumph | 129 | 187 |
| Hyosung | 149 | 166 |
| Longjia | 158 | 148 |
| Husqvarna | 109 | 136 |
| Aprilia | 72 | 99 |
| Ducati | 67 | 85 |
| TGB | 111 | 81 |
| Vespa | 66 | 78 |
| BMW | 47 | 71 |
| Bolwell | 78 | 66 |
| Vmoto | 115 | 66 |


