Commuting is easier and safer in Perth than any other Australian city, while Sydney is the worst, according to a German traffic study.
While lane filtering now allows riders to dodge the worst of the daily commute, riders still face commuting costs of fuel and parking, traffic crashes and road rage.
German automotive website, Kfzteile24, studied 10 wide-reaching commuting factors and covers commuters on all types of transport, including motorcycles.
Perth rated the best place in Australia for commuting at 19th, followed by Brisbane at 45th, Melbourne 55th, Adelaide surprisingly at 57th and Sydney worst 61st.
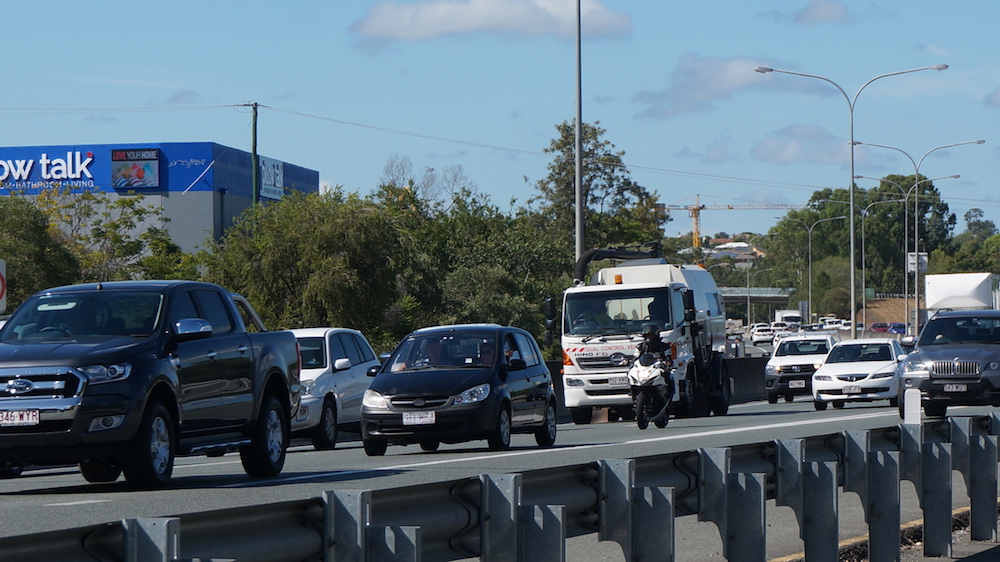
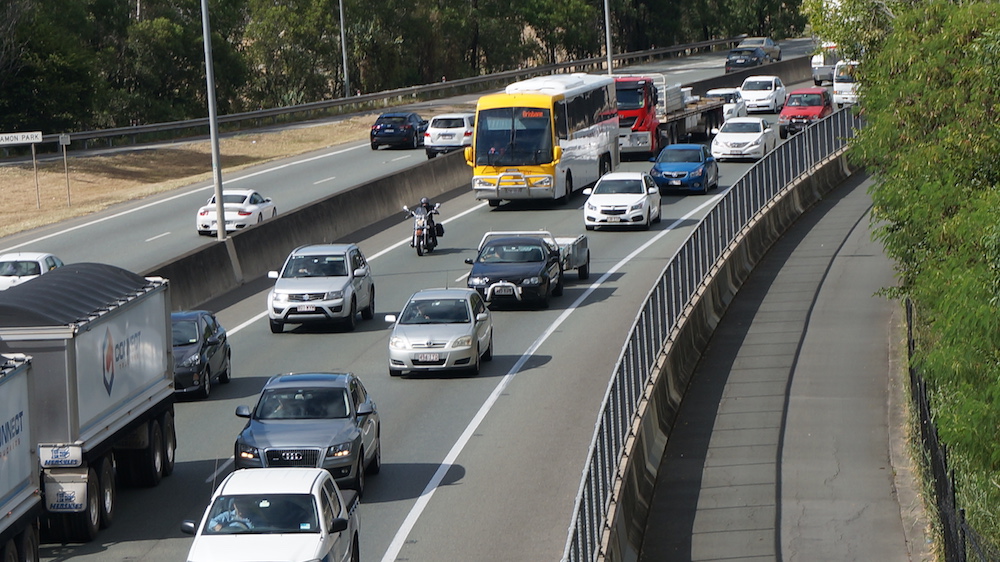 Brisbane traffic
Congestion ratings
Based on the TomTom Traffic Index, congestion is worst in Kolkota, India, with a score of 69% and best was Bern in Switzerland and the Dutch city of Rotterdam at 19%.
By comparison Perth and Adelaide are 27%, Brisbane 28%, Melbourne 33% and Sydney39%.
Consequently, road rage in Sydney was the 21st worst with the worst being in St Petersburg, Russia.
The study listed the cost of fuel as 90c US (about $A1.12) across all Australian capitals.
The highest fuel costs were in Hong Kong at $US1.94 (about $A2.43) and the lowest were in Lagos in Nigeria at 46c (about 59c), even lower than oil-rich Dubai at 48c.
Safest commuting
Safest place for commuting is in Switzerland with three Swiss cities scoring a perfect score of 10, while the worst was Bangkok with 1.
Australia is comparatively safe with a score of 5.81 across all cities.
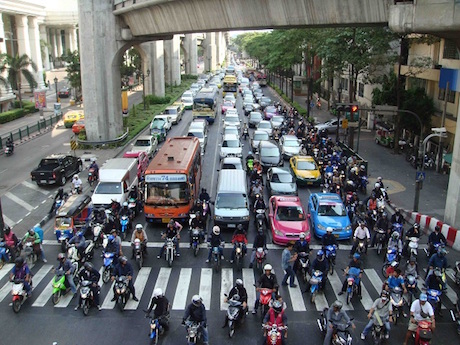 Bangkok traffic
Road quality
Best roads are generally in Europe, but the perfect score of 10 was shared by Singapore, Helsinki, Marseille, Bordeaux, Paris, Manchester and Nice.
While good roads generally mean fewer commuting crash injures, there are some glaring anomalies such as Manchester which scored badly on crashes.
Once again, the commuting study gave the same score of 7.26 to all listed Australian cities.
The results below show scores for each commuting category with a final rank at the end. Low numbers are bad and high numbers are good.
(If you can’t read the table properly, try a desktop computer or turning your phone or tablet sideways.)
| # | City | Country | Traffic
jams |
Fuel ($US) |
Diesel
($US) |
Public
Trans |
Parking
cost |
Speed
to airport |
Air
quality |
Crash
injuries |
Road
quality |
Road
rage |
Rank |
|---|---|---|---|---|---|---|---|---|---|---|---|---|---|
| 1 | Dusseldorf | Germany | 20% | 1.52 | 1.31 | 8.88 | 1.74 | 21.20 | 5.55 | 7.03 | 9.23 | 8.96 | 1 |
| 2 | Dubai | UAE | 26% | 0.48 | 0.51 | 3.81 | 4.54 | 31.70 | 8.00 | 9.13 | 8.24 | 8.65 | 2 |
| 3 | Zurich | Switzerland | 31% | 1.42 | 1.49 | 9.59 | 3.65 | 25.50 | 7.00 | 8.78 | 9.80 | 9.86 | 3 |
| 4 | Tokyo | Japan | 26% | 1.14 | 0.94 | 10.00 | 4.18 | 30.50 | 4.27 | 6.94 | 8.83 | 8.45 | 4 |
| 5 | Basel | Switzerland | 27% | 1.42 | 1.49 | 9.01 | 2.55 | 17.50 | 7.64 | 10.00 | 9.80 | 9.91 | 5 |
| 6 | Singapore | Singapore | 38% | 1.44 | 0.99 | 8.56 | 1.39 | 32.40 | 3.45 | 8.69 | 10.00 | 8.25 | 6 |
| 7 | Dortmund | Germany | 23% | 1.49 | 1.26 | 7.39 | 1.74 | 19.90 | 5.18 | 7.03 | 9.23 | 9.01 | 7 |
| 8 | Vienna | Austria | 31% | 1.26 | 1.16 | 9.75 | 3.94 | 28.00 | 5.09 | 5.81 | 9.60 | 9.87 | 8 |
| 9 | Munich | Germany | 30% | 1.50 | 1.28 | 9.26 | 2.09 | 27.40 | 6.73 | 7.03 | 9.23 | 7.28 | 9 |
| 10 | Calgary | Canada | 20% | 0.93 | 0.77 | 8.27 | 10.96 | 26.80 | 10.00 | 5.19 | 8.83 | 7.19 | 10 |
| 11 | Bern | Switzerland | 19% | 1.42 | 1.49 | 8.65 | 2.78 | 12.40 | 6.45 | 10.00 | 9.80 | 9.78 | 11 |
| 12 | Stuttgart | Germany | 28% | 1.50 | 1.27 | 8.06 | 2.09 | 24.90 | 5.73 | 7.03 | 9.23 | 8.18 | 12 |
| 13 | Montreal | Canada | 29% | 0.93 | 0.77 | 9.01 | 7.04 | 23.00 | 8.82 | 5.19 | 8.83 | 8.81 | 13 |
| 14 | Toronto | Canada | 30% | 0.93 | 0.77 | 8.69 | 7.83 | 25.60 | 9.18 | 5.19 | 8.83 | 8.38 | 14 |
| 15 | Helsinki | Finland | 31% | 1.55 | 1.34 | 8.85 | 4.18 | 20.00 | 7.64 | 6.42 | 10.00 | 10.00 | 15 |
| 16 | Seattle | USA | 34% | 0.70 | 0.67 | 8.27 | 10.61 | 36.10 | 9.82 | 3.10 | 8.43 | 9.37 | 16 |
| 17 | Frankfurt | Germany | 28% | 1.51 | 1.27 | 7.64 | 3.13 | 20.50 | 4.73 | 7.03 | 9.23 | 8.78 | 17 |
| 18 | Amsterdam | Netherlands | 22% | 1.67 | 1.30 | 6.36 | 5.45 | 18.80 | 6.09 | 8.51 | 9.03 | 9.51 | 18 |
| 19 | Perth | Australia | 27% | 0.90 | 0.94 | 5.21 | 2.78 | 21.20 | 8.27 | 5.81 | 7.26 | 8.29 | 19 |
| 20 | Essen | Germany | 28% | 1.48 | 1.26 | 5.46 | 2.61 | 20.00 | 5.91 | 7.03 | 9.23 | 8.83 | 20 |
| 21 | Madrid | SPAIN | 25% | 1.29 | 1.17 | 3.97 | 2.90 | 24.30 | 7.91 | 8.17 | 8.83 | 6.15 | 21 |
| 22 | Ottawa | Canada | 28% | 0.93 | 0.77 | 7.52 | 6.66 | 18.10 | 9.91 | 5.19 | 8.83 | 8.45 | 22 |
| 23 | San Antonio | USA | 20% | 0.70 | 0.67 | 4.96 | 10.12 | 24.90 | 8.64 | 3.10 | 8.43 | 8.22 | 23 |
| 24 | Geneva | Switzerland | 29% | 1.42 | 1.49 | 8.87 | 3.57 | 11.20 | 7.27 | 10.00 | 9.80 | 9.73 | 24 |
| 25 | Hamburg | Germany | 33% | 1.49 | 1.25 | 8.42 | 1.74 | 12.50 | 6.82 | 7.03 | 9.23 | 9.26 | 25 |
| 26 | Stockholm | Sweden | 28% | 1.57 | 1.53 | 5.88 | 9.05 | 36.20 | 5.00 | 9.65 | 8.24 | 9.33 | 26 |
| 27 | Marseille | France | 29% | 1.46 | 1.31 | 4.06 | 2.67 | 29.90 | 4.09 | 6.42 | 10.00 | 8.45 | 27 |
| 28 | Prague | Czech Rep | 23% | 1.20 | 1.16 | 7.35 | 4.41 | 16.80 | 4.55 | 8.43 | 8.43 | 7.17 | 28 |
| 29 | Graz | Austria | 29% | 1.26 | 1.16 | 6.71 | 3.02 | 16.20 | 5.36 | 5.81 | 9.60 | 9.86 | 29 |
| 30 | Rotterdam | Netherlands | 19% | 1.67 | 1.30 | 8.76 | 4.64 | 13.10 | 6.00 | 8.51 | 9.03 | 6.54 | 30 |
| 31 | Berlin | Germany | 29% | 1.49 | 1.26 | 9.84 | 1.97 | 13.10 | 5.82 | 7.03 | 9.23 | 6.11 | 31 |
| 32 | Barcelona | SPAIN | 31% | 1.29 | 1.17 | 6.71 | 3.94 | 20.00 | 5.64 | 8.17 | 8.83 | 7.19 | 32 |
| 33 | Cologne | Germany | 34% | 1.51 | 1.27 | 6.94 | 2.09 | 20.60 | 5.45 | 7.03 | 9.23 | 7.03 | 33 |
| 34 | Birmingham | UK | 40% | 1.51 | 1.52 | 8.43 | 4.54 | 27.30 | 9.55 | 9.13 | 8.24 | 6.44 | 34 |
| 35 | Bremen | Germany | 32% | 1.51 | 1.27 | 8.22 | 2.67 | 11.20 | 7.09 | 7.03 | 9.23 | 8.81 | 35 |
| 36 | Seoul | Korea | 30% | 1.27 | 1.09 | 9.33 | 5.36 | 29.30 | 2.82 | 4.15 | 8.63 | 6.85 | 36 |
| 37 | Oslo | Norway | 30% | 1.83 | 1.70 | 8.09 | 6.15 | 44.10 | 6.36 | 8.08 | 4.33 | 9.48 | 37 |
| 38 | Glasgow | UK | 30% | 1.51 | 1.52 | 5.70 | 2.67 | 16.80 | 9.36 | 9.13 | 8.24 | 4.73 | 38 |
| 39 | Bordeaux | France | 40% | 1.46 | 1.31 | 6.94 | 2.78 | 13.80 | 6.45 | 6.42 | 10.00 | 10.00 | 39 |
| 40 | Auckland | New Zealand | 38% | 1.41 | 0.88 | 8.51 | 12.13 | 23.70 | 9.27 | 5.19 | 6.87 | 8.92 | 40 |
| 41 | Austin | USA | 25% | 0.70 | 0.67 | 5.21 | 6.07 | 16.20 | 8.18 | 3.10 | 8.43 | 7.35 | 41 |
| 42 | Toulouse | France | 29% | 1.46 | 1.31 | 4.64 | 3.13 | 13.20 | 7.36 | 7.03 | 9.23 | 7.91 | 42 |
| 43 | Philadelphia | USA | 23% | 0.70 | 0.67 | 5.30 | 17.19 | 18.70 | 7.73 | 3.10 | 8.43 | 6.00 | 43 |
| 44 | Edinburgh | UK | 29% | 1.51 | 1.52 | 8.09 | 5.94 | 13.70 | 6.18 | 9.13 | 8.24 | 6.17 | 44 |
| 45 | Brisbane | Australia | 28% | 0.90 | 0.94 | 4.22 | 14.72 | 17.40 | 8.73 | 5.81 | 7.26 | 8.42 | 45 |
| 46 | London | UK | 38% | 1.51 | 1.52 | 9.91 | 10.44 | 16.20 | 8.09 | 9.13 | 8.24 | 6.85 | 46 |
| 47 | Wellington | New Zealand | 34% | 1.41 | 0.88 | 7.77 | 3.82 | 10.70 | 9.64 | 5.19 | 6.87 | 8.94 | 47 |
| 48 | Vancouver | Canada | 39% | 0.93 | 0.77 | 8.18 | 5.87 | 15.00 | 9.73 | 5.19 | 8.83 | 5.59 | 48 |
| 49 | Liverpool | UK | 40% | 1.51 | 1.52 | 8.60 | 6.51 | 15.60 | 6.55 | 9.13 | 8.24 | 8.42 | 49 |
| 50 | Boston | USA | 28% | 0.70 | 0.67 | 6.94 | 16.44 | 16.80 | 7.36 | 3.10 | 8.43 | 5.81 | 50 |
| 51 | Paris | France | 27% | 1.46 | 1.31 | 9.50 | 4.99 | 15.00 | 4.45 | 6.42 | 10.00 | 2.31 | 51 |
| 52 | Chicago | USA | 26% | 0.70 | 0.67 | 9.26 | 15.16 | 13.80 | 6.64 | 3.10 | 8.43 | 4.22 | 52 |
| 53 | Tallinn | Estonia | 26% | 1.25 | 1.23 | 5.37 | 4.18 | 8.80 | 9.45 | 6.85 | 9.23 | 4.58 | 53 |
| 54 | Budapest | Hungary | 22% | 1.20 | 1.19 | 2.49 | 1.86 | 16.80 | 4.00 | 4.58 | 5.10 | 7.59 | 54 |
| 55 | Melbourne | Australia | 33% | 0.90 | 0.94 | 2.98 | 15.50 | 17.50 | 7.82 | 5.81 | 7.26 | 8.78 | 55 |
| 56 | San Diego | USA | 27% | 0.70 | 0.67 | 3.56 | 10.12 | 11.20 | 9.00 | 3.10 | 8.43 | 8.13 | 56 |
| 57 | Adelaide | Australia | 27% | 0.90 | 0.94 | 1.90 | 7.08 | 11.90 | 8.36 | 5.81 | 7.26 | 9.33 | 57 |
| 58 | Lisbon | Portugal | 36% | 1.57 | 1.32 | 7.19 | 2.09 | 8.10 | 9.09 | 4.50 | 9.80 | 4.73 | 58 |
| 59 | Manchester | UK | 29% | 1.51 | 1.52 | 9.10 | 5.89 | 14.30 | 1.36 | 3.01 | 10.00 | 7.21 | 59 |
| 60 | Tel Aviv | Israel | 39% | 1.69 | 1.55 | 5.63 | 1.72 | 21.90 | 2.64 | 8.34 | 6.47 | 3.68 | 60 |
| 61 | Sydney | Australia | 39% | 0.90 | 0.94 | 9.68 | 26.34 | 15.60 | 8.45 | 5.81 | 7.26 | 4.04 | 61 |
| 62 | Cape Town | South Africa | 35% | 0.96 | 0.96 | 7.19 | 1.02 | 17.50 | 2.18 | 1.09 | 6.87 | 3.70 | 62 |
| 63 | Copenhagen | Denmark | 32% | 1.61 | 1.35 | 5.79 | 4.41 | 16.20 | 4.82 | 4.67 | 5.50 | 9.35 | 63 |
| 64 | Kuala Lumpur | Malaysia | 43% | 0.49 | 0.47 | 2.82 | 1.06 | 30.50 | 2.73 | 1.35 | 7.84 | 4.22 | 64 |
| 65 | Miami | USA | 30% | 0.70 | 0.67 | 2.85 | 6.07 | 19.40 | 7.55 | 3.10 | 8.43 | 2.76 | 65 |
| 66 | Nice | France | 38% | 1.46 | 1.31 | 4.64 | 4.99 | 12.40 | 4.18 | 6.42 | 10.00 | 7.91 | 66 |
| 67 | Johannesburg | South Africa | 47% | 0.96 | 0.96 | 7.77 | 1.93 | 26.80 | 1.73 | 1.09 | 6.87 | 4.74 | 67 |
| 68 | Riga | Latvia | 23% | 1.14 | 1.01 | 2.57 | 2.90 | 18.10 | 3.55 | 4.06 | 3.54 | 5.28 | 68 |
| 69 | Dublin | Ireland | 43% | 1.44 | 1.28 | 4.47 | 3.19 | 9.40 | 8.91 | 7.99 | 7.84 | 6.65 | 69 |
| 70 | New York | USA | 35% | 0.70 | 0.67 | 9.42 | 27.61 | 11.20 | 8.55 | 3.10 | 8.43 | 2.58 | 70 |
| 71 | Antwerp | Belgium | 30% | 1.47 | 1.35 | 3.48 | 2.84 | 10.00 | 4.64 | 4.76 | 8.04 | 7.48 | 71 |
| 72 | Brussells | Belgium | 38% | 1.47 | 1.35 | 2.82 | 3.36 | 14.40 | 5.27 | 4.76 | 8.04 | 7.71 | 72 |
| 73 | Athens | Greece | 36% | 1.64 | 1.36 | 6.04 | 6.61 | 35.50 | 3.18 | 1.96 | 9.60 | 3.14 | 73 |
| 74 | Santiago | Chile | 43% | 1.13 | 0.73 | 2.08 | 2.74 | 22.40 | 2.00 | 2.83 | 8.24 | 4.55 | 74 |
| 75 | Milan | Italy | 27% | 1.63 | 1.47 | 1.99 | 6.03 | 34.90 | 3.27 | 4.93 | 5.70 | 4.19 | 75 |
| 76 | Los Angeles | USA | 45% | 0.70 | 0.67 | 4.22 | 10.12 | 20.50 | 7.27 | 3.10 | 8.43 | 3.68 | 76 |
| 77 | Beijing | China | 46% | 0.95 | 0.84 | 1.83 | 1.50 | 22.40 | 1.64 | 1.96 | 5.90 | 6.26 | 77 |
| 78 | Shanghai | China | 48% | 0.95 | 0.84 | 2.24 | 1.64 | 34.90 | 1.82 | 2.31 | 2.37 | 7.17 | 78 |
| 79 | Rome | Italy | 35% | 1.63 | 1.47 | 3.30 | 4.87 | 22.40 | 4.36 | 4.93 | 5.70 | 3.52 | 79 |
| 80 | Buenos Airies | Argentina | 42% | 1.30 | 1.14 | 4.96 | 2.01 | 25.60 | 4.91 | 2.75 | 3.16 | 1.92 | 80 |
| 81 | Sofia | Bulgaria | 29% | 1.11 | 1.08 | 2.66 | 1.18 | 13.20 | 2.91 | 4.41 | 2.17 | 3.02 | 81 |
| 82 | Hong Kong | China | 41% | 1.94 | 1.52 | 3.30 | 3.18 | 39.20 | 2.45 | 1.96 | 5.90 | 5.09 | 82 |
| 83 | Warsaw | Poland | 37% | 1.15 | 1.11 | 3.81 | 1.16 | 10.60 | 3.64 | 3.97 | 2.37 | 4.01 | 83 |
| 84 | Moscow | Russia | 41% | 0.70 | 0.65 | 4.96 | 3.34 | 18.10 | 3.73 | 1.79 | 1.77 | 2.12 | 84 |
| 85 | Bangkok | Thailand | 61% | 0.98 | 0.73 | 2.91 | 1.35 | 21.20 | 3.00 | 1.00 | 7.07 | 3.54 | 85 |
| 86 | St Petersburg | Russia | 44% | 0.70 | 0.65 | 6.04 | 3.34 | 17.40 | 3.73 | 1.79 | 1.77 | 1.00 | 86 |
| 87 | Jakarta | Indonesia | 58% | 0.63 | 0.68 | 1.09 | 0.38 | 17.50 | 2.09 | 2.66 | 3.93 | 3.68 | 87 |
| 88 | Bucharest | Romania | 50% | 1.11 | 1.10 | 2.31 | 0.57 | 16.20 | 3.91 | 4.32 | 1.00 | 3.99 | 88 |
| 89 | Sao Paulo | Brazil | 30% | 1.18 | 0.97 | 3.20 | 6.21 | 15.00 | 3.36 | 1.44 | 2.57 | 4.06 | 89 |
| 90 | Rio de Janeiro | Brazil | 37% | 1.18 | 0.97 | 3.56 | 4.13 | 12.50 | 2.55 | 1.44 | 2.57 | 4.51 | 90 |
| 91 | Istanbul | Turkey | 49% | 1.47 | 1.29 | 1.56 | 1.69 | 11.80 | 2.27 | 4.23 | 6.87 | 1.49 | 91 |
| 92 | Mexico City | Mexico | 66% | 0.92 | 0.87 | 5.46 | 6.97 | 17.50 | 3.09 | 2.92 | 6.09 | 4.62 | 92 |
| 93 | Bogota | Colombia | 48% | 0.75 | 0.69 | 1.56 | 5.22 | 12.50 | 2.36 | 4.93 | 4.53 | 1.22 | 93 |
| 94 | Ho Chi Minh | Vietnam | 64% | 0.79 | 0.61 | 1.16 | 1.10 | 14.90 | 1.91 | 1.26 | 2.57 | 5.77 | 94 |
| 95 | Bangalore | India | 64% | 1.12 | 0.93 | 1.32 | 0.86 | 18.70 | 1.45 | 2.40 | 4.13 | 1.94 | 95 |
| 96 | Mumbai | India | 67% | 1.12 | 0.93 | 6.04 | 0.95 | 8.10 | 1.55 | 2.40 | 4.13 | 3.20 | 96 |
| 97 | Ulaanbaatar | Mongolia | 65% | 0.63 | 0.68 | 1.00 | 2.00 | 21.80 | 1.18 | 1.61 | 1.20 | 4.19 | 97 |
| 98 | Lagos | Nigeria | 60% | 0.46 | 0.65 | 1.25 | 0.32 | 10.70 | 1.00 | 1.70 | 2.76 | 3.50 | 98 |
| 99 | Karachi | Pakistan | 59% | 0.66 | 0.74 | 1.38 | 0.56 | 11.20 | 1.09 | 2.22 | 3.54 | 1.81 | 99 |
| 100 | Kolkota | India | 69% | 1.12 | 0.93 | 1.41 | 0.31 | 11.20 | 1.27 | 2.40 | 4.13 | 4.24 | 100 |